

You’ve flown your first orthomosaic. The result was usable but not great. Coverage had gaps in the corners. The edges looked blurry compared to the center. You checked your settings afterward and realized you flew at 300 feet with 60% overlap at 7 m/s — essentially the opposite of what the software manual suggested.
Every parameter you chose — altitude, overlap, speed, camera interval — directly affected the output quality. Most drone pilots learn this by trial and error, which wastes batteries and time. This is how to get it right the first time.
Ground Sample Distance (GSD): The Foundation of Drone Mapping Flight Parameters
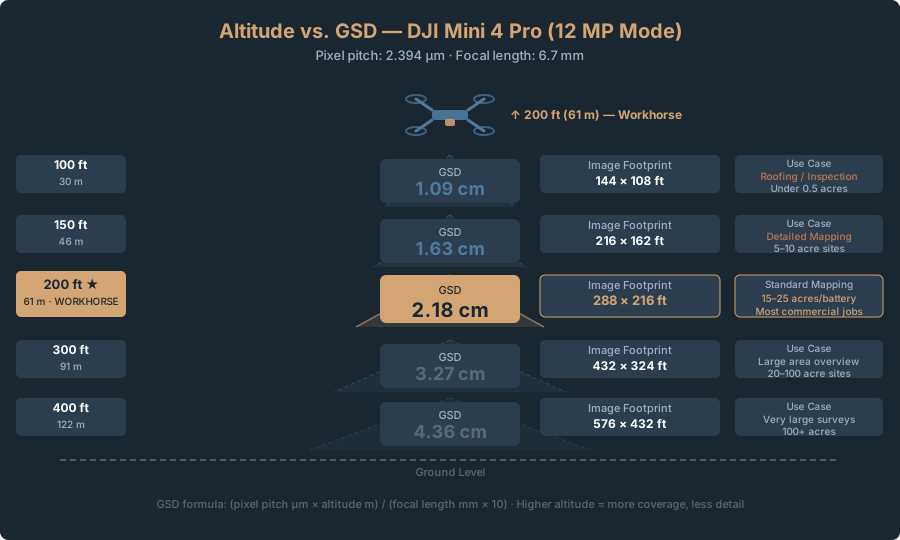
Ground Sample Distance (GSD) is the physical distance on the ground that each pixel in your image represents. A 2.2 cm GSD means one pixel covers 2.2 centimeters on the ground. A 5 cm GSD means one pixel covers 5 centimeters.
GSD determines both detail level and file size. Smaller GSD means finer detail but requires lower altitude or higher resolution. Every other flight parameter cascades from this number.
The formula:
GSD (cm) = (pixel pitch in μm × altitude in m) / (focal length in mm × 10)
For the DJI Mini 4 Pro (12 MP mode — 2x2 pixel binning from the 48 MP sensor):
- Focal length: 6.7 mm (actual)
- Pixel pitch: 2.394 μm (binned)
At 200 feet (61 meters), your GSD is ~2.2 cm. At 100 feet (30 meters), it drops to ~1.1 cm — twice the detail. At 400 feet (122 meters), it jumps to ~4.4 cm — less detail, more ground coverage.
Use the GSD Calculator to compute exact GSD and image footprint for any altitude and drone model.
| Altitude | GSD (Mini 4 Pro, 12 MP) | Image Footprint | Use Case |
|---|---|---|---|
| 100 ft (30 m) | 1.09 cm | 144 x 108 ft | Roofing inspection, wall detail, small sites under 0.5 acres |
| 150 ft (46 m) | 1.63 cm | 216 x 162 ft | Detailed mapping, small construction sites |
| 200 ft (61 m) | 2.18 cm | 288 x 216 ft | Standard mapping — workhorse setting for most jobs |
| 300 ft (91 m) | 3.27 cm | 432 x 324 ft | Large area overview, agricultural surveys, 20+ acre sites |
| 400 ft (122 m) | 4.36 cm | 576 x 432 ft | Very large areas, 100+ acres, low-detail overview work |
Most commercial mapping falls in the 1.1 to 3.3 cm GSD range. Finer than that and you’re capturing beyond what processing software can reliably extract. Coarser and you lose detail that clients expect.
Drone Mapping Overlap Settings: The 80% Frontal Overlap Rule
Frontal overlap is the percentage of image overlap along your flight path — the direction the drone is moving.
Think of walking down a hallway taking photos every few steps. Step too far apart and your photos barely overlap — gaps between shots. Step close together and each photo heavily overlaps the last, capturing everything multiple times.
In drone mapping, overlapping images give your photogrammetry software matching points — distinctive pixels that appear in multiple photos from different angles. Structure-from-motion processing uses these matching points to reconstruct 3D geometry. More overlap means more matching points and better geometry.
Here’s what actually happens at each level:
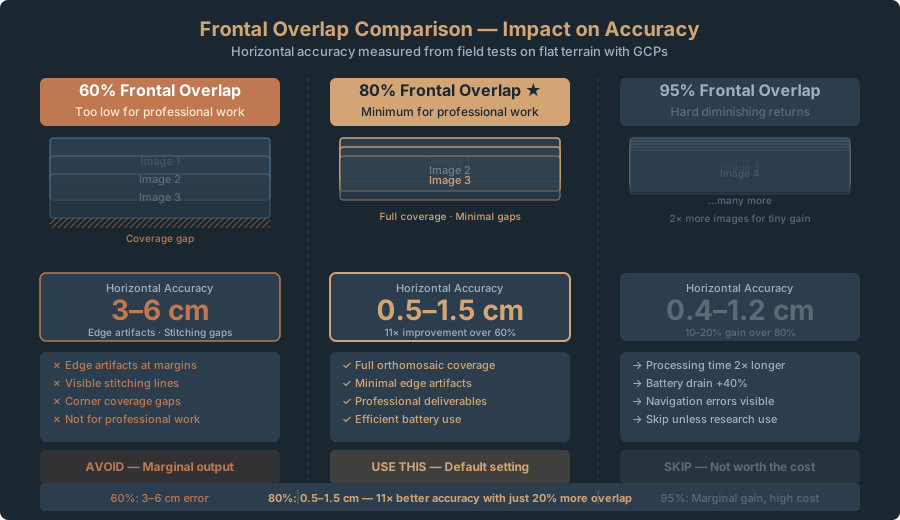
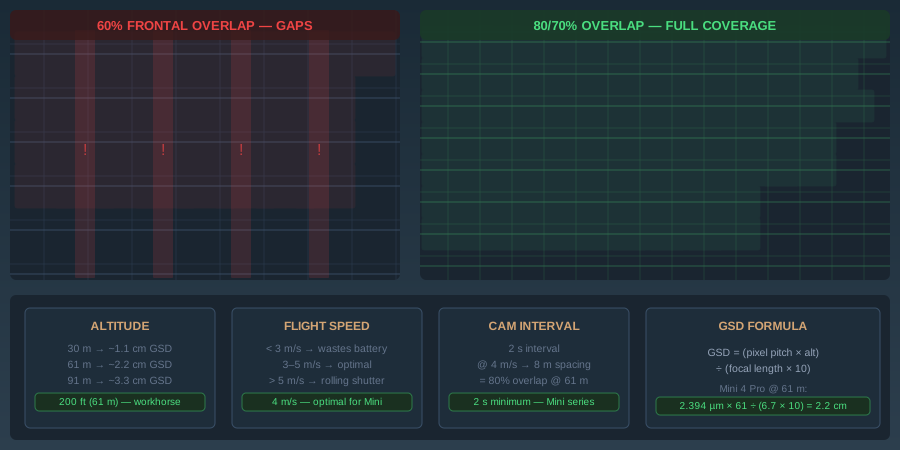
60% frontal overlap (too low for mapping). Published overlap studies show horizontal accuracy degrading noticeably on low-texture terrain. Edge artifacts, visible stitching problems along orthomosaic margins, coverage gaps in corners and flight line boundaries. Processing is faster but the output is marginal. Not for professional work.
80% frontal overlap (minimum for professional work). Horizontal accuracy tightens significantly — a step change from 20 percentage points of additional overlap. Full coverage, minimal edge artifacts. Processing takes longer but the output quality is worth it.
90% frontal overlap. Maybe another 10-20% accuracy gain, but processing time roughly doubles and battery drain increases. Unless you’re flying a small area with battery to spare, not worth it.
95%+ frontal overlap. Hard diminishing returns. Processing gets computationally heavy, and positional errors from the drone’s navigation start introducing distortions. Skip this unless you’re doing research with unlimited compute.
Bottom line: 80% frontal overlap gets you professional accuracy without killing your battery budget. Use it as your default.
Side Overlap: The Coverage Safety Net
Side overlap is the percentage overlap between adjacent flight lines running perpendicular to your direction of travel.
Fly one north-south line, then fly another parallel line to the east. The two lines overlap where they’re closest together. Side overlap measures that lateral coverage.
70% side overlap is your floor. Below this, coverage gaps and triangulation errors show up at the edges of each flight line — the software can’t reliably match points across the gap.
- 70% side overlap. Adequate. Flight line edges match well, minimal gaps in normal terrain.
- 80% side overlap. Professional-grade. Handles terrain undulation well. Standard for building surveys and construction mapping.
- 90% side overlap. Overkill for flat ground. Worth it for heavily forested areas or steep slopes where shadows kill feature matching.
Let your mission planning software (Litchi, DJI Fly, or WaypointMap) calculate side overlap automatically. Don’t hand-calculate it — drift and wind effects make manual math unreliable.
Flight Speed: The Shutter Speed Relationship
Flight speed affects two things: image spacing and rolling shutter distortion.
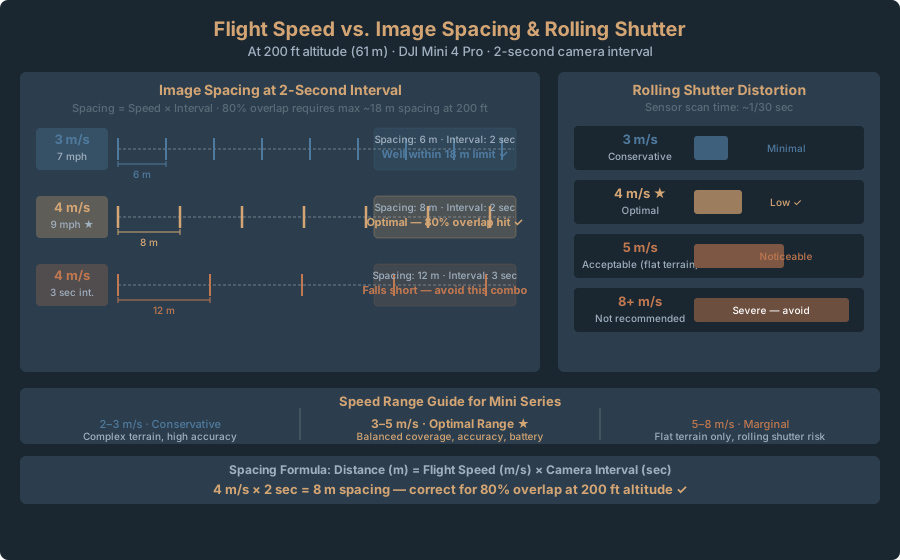
Image spacing is straightforward. Speed × camera interval = distance between photos.
At 4 m/s with a 2-second camera interval, you capture images every 8 meters along the flight line. That’s enough for 80% overlap at 200 feet altitude with the Mini 4 Pro.
Rolling shutter distortion is more subtle — and matters more.
The Mini 4 Pro uses a rolling shutter: the camera scans the sensor row-by-row, not all at once. During the scan (which takes roughly 1/30 of a second), the drone is moving. The top of the image captures a slightly different location than the bottom, creating a skew or tilt effect especially visible on fast-moving ground features.
At 3 m/s, rolling shutter distortion is minimal. At 5 m/s, it’s noticeable. At 8+ m/s, it becomes a real problem — the orthomosaic shows subtle warping in orthogonal structures (roads, building edges) and the photogrammetry software struggles to match points consistently.
Flight speed recommendations for Mini series:
- 2-3 m/s (4.5-7 mph): Conservative, great for complex terrain and high-accuracy work. Uses more battery for the same area.
- 3-5 m/s (7-11 mph): Optimal range. Balances coverage, accuracy, and battery life. This is your workhorse speed.
- 5-8 m/s (11-18 mph): Acceptable for simple, featureless terrain (agricultural fields, flat terrain). Adds detectable rolling shutter distortion. Risk of coverage gaps if not carefully planned.
- 8+ m/s (18+ mph): Not recommended for mapping. Use only for quick visual reconnaissance, not deliverables.
Camera Interval: The Spacing Calculator
The DJI Mini 4 Pro supports camera intervals down to 2 seconds. This is your minimum. On the Mini 3 Pro, it’s also 2 seconds.
To calculate image spacing:
Spacing (m) = Flight Speed (m/s) × Camera Interval (seconds)
Examples:
- 4 m/s × 2 sec = 8 m spacing
- 4 m/s × 3 sec = 12 m spacing
- 3 m/s × 2 sec = 6 m spacing
For 80% overlap at 200 feet altitude on the Mini 4 Pro:
At 200 feet (61 m), your image footprint is roughly 88 x 66 meters (288 x 216 ft). Along the flight direction (88 m), 80% overlap means images need to overlap by 70 meters. Maximum spacing is 18 meters (59 ft). At 4 m/s with a 2-second interval, you get 8-meter spacing — well within the requirement.
If you fly 3 m/s, you need a 2.7-second interval to hit 8m spacing. The drone only supports 2-second intervals, so at 3 m/s you’d need to adjust path overlap or accept slightly lower spacing coverage.
Adjust interval up if:
- Spacing becomes too dense (e.g., 4-5 meter spacing). You’re burning SD card space and adding processing load for minimal accuracy gain.
- Your flight takes so long that battery becomes limiting.
Adjust interval down if:
- Spacing is too sparse (over 12 meters at 200 ft altitude). Overlap drops below 70% and coverage gaps appear.
The Altitude Selection Guide
Altitude is a tradeoff between detail, coverage, and flight time.
| Altitude | GSD | Battery per 20 acres | Use Case | Notes |
|---|---|---|---|---|
| 100 ft | 1.1 cm | 8-10 flights | Roofing inspection, close detail | Need very fast flight speed; wind is enemy. Limited area coverage. |
| 150 ft | 1.6 cm | 5-6 flights | Construction progress monitoring | Good balance for 5-10 acre sites. Standard for structural surveys. |
| 200 ft | 2.2 cm | 3-4 flights | Standard mapping — most jobs | Workhorse altitude. Covers 15-25 acres per battery on favorable wind. |
| 300 ft | 3.3 cm | 2-3 flights | Large property overviews | Good for 30-100 acre sites. GSD still acceptable for planning documents. |
| 400 ft | 4.4 cm | 1-2 flights | Very large area surveys | Covers 100+ acres per flight. Detail diminished but sufficient for low-resolution deliverables. |
Detailed inspection work (roofing, solar panels, wall conditions): 80-120 feet. You need to see texture and defects. Wind is your enemy at this altitude.
Standard mapping (site plans, progress photos, property surveys): 200 feet. This is where the Mini series shines. You get good detail without excessive flight time, and wind effects are manageable.
Large area work (agricultural surveys, municipal parcel mapping, environmental assessments): 300-400 feet. You trade some detail for coverage and battery efficiency.
Battery Budget: Estimating Coverage Per Flight
This is the math that separates plans from reality.
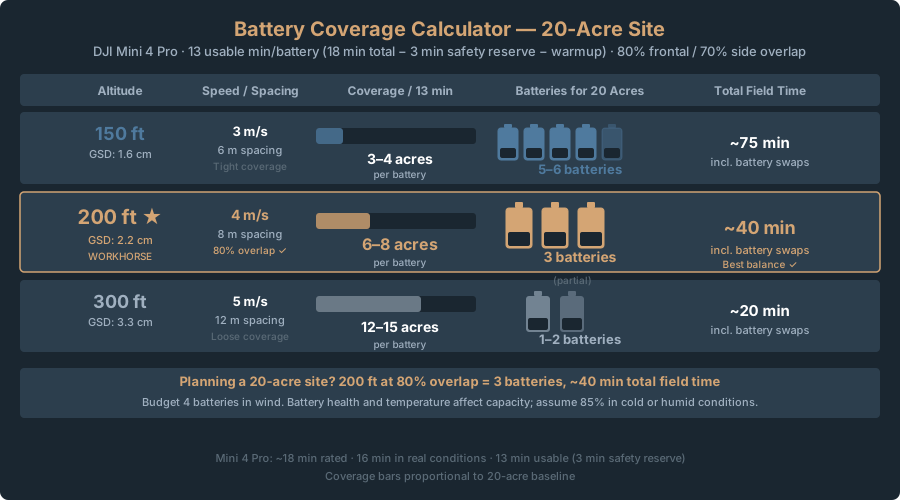
The DJI Mini 4 Pro has roughly 34 minutes of flight time on a standard battery in calm conditions (45 minutes with the Battery Plus). In real conditions with wind and mapping-load camera trigger cycles, assume closer to 25-28 minutes. Three minutes is your safety reserve (land with 3+ minutes remaining). That leaves 22-25 usable minutes per standard battery.
At 200 feet altitude with 80% overlap and 70% side overlap, coverage rate is roughly 10-15 acres per usable-flight window, depending on terrain and weather.
Here’s the formula:
Coverage (acres) = (Altitude in feet² × usable flight time in minutes) / (100 × seconds per coverage unit)
It’s simpler to use this practical table:
| Altitude | Spacing | Speed | Coverage per 13 min flight | Batteries needed (10 acres) |
|---|---|---|---|---|
| 150 ft | Tight (6 m) | 3 m/s | 3-4 acres | 3 |
| 200 ft | Standard (8 m) | 4 m/s | 6-8 acres | 2 |
| 300 ft | Loose (12 m) | 5 m/s | 12-15 acres | 1 |
| 400 ft | Very loose (16 m) | 5 m/s | 20-25 acres | 0.5 |
Planning a 20-acre site? At 200 feet with 80% overlap, budget 3 batteries minimum (assuming calm wind and good battery health). Plan for 4 if there’s any wind.
Wind Effects
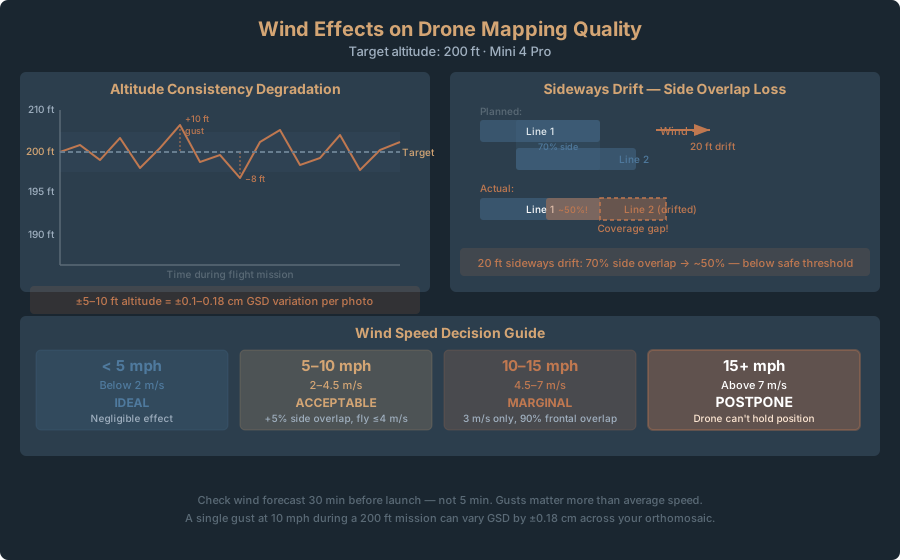
Wind doesn’t just push you sideways. It degrades altitude consistency and forward motion uniformity — both of which wreck your data.
Altitude consistency: A 10 mph (4.5 m/s) wind gust pushes the Mini 4 Pro 5-10 feet above or below target. Your altitude bounces. Your GSD bounces with it. A photo taken 5 feet higher has ~0.18 cm worse GSD. When stitching 100+ photos with varying GSD, the photogrammetry software struggles.
Forward motion uniformity: Wind pushes you sideways. Your flight line drifts. You planned 70% side overlap, but wind pushes one line 20 feet west. Overlap between lines drops to 50%. Coverage gaps appear.
Wind speed guidelines:
- Below 5 mph (2 m/s): Ideal. Negligible effect.
- 5-10 mph (2-4.5 m/s): Acceptable. Fly at 4 m/s or slower. Increase side overlap by 5%. Stay aware of gusts.
- 10-15 mph (4.5-7 m/s): Marginal. Fly at 3 m/s. Tighten overlap to 90% frontal if possible. Expect longer processing due to poorer image quality.
- Above 15 mph (7 m/s): Postpone. Your drone will struggle to hold position, altitude, and speed. Not worth the risk.
Check wind 30 minutes before launch, not 5 minutes before. Wind conditions change. If gusts are forecasted, reschedule.
The Optimization Matrix: Parameter Combinations by Project Type
Different jobs need different parameter combinations. These are the established patterns:
| Project | Altitude | Frontal | Side | Speed | Interval | GSD | Notes |
|---|---|---|---|---|---|---|---|
| Quick overview | 300-400 ft | 70% | 60% | 5 m/s | 3 sec | 3.3-4.4 cm | Fast, low detail. Client reference only. |
| Standard mapping | 200 ft | 80% | 70% | 4 m/s | 2 sec | 2.2 cm | Professional output. Balanced coverage and detail. |
| High accuracy (with GCPs) | 150 ft | 85% | 75% | 3 m/s | 2 sec | 1.6 cm | For deliverables requiring sub-cm accuracy. More flights needed. |
| Large area (100+ acres) | 350 ft | 75% | 65% | 5 m/s | 2.5 sec | 3.8 cm | Accept some loss of detail for coverage. |
| Complex terrain | 150 ft | 85% | 80% | 3 m/s | 2 sec | 1.6 cm | Tight overlap handles slopes, shadows, vegetation. |
| Roofing / structure | 100 ft | 80% | 75% | 2.5 m/s | 2 sec | 1.1 cm | Maximum detail. Very slow, battery-intensive, but captures defects. |
Legal Accuracy Claims
Professional-grade flight parameters don’t make you a licensed surveyor. The accuracy you achieve with optimized overlap and GCPs can trigger state surveying license requirements — especially volume calculations and topographic data used for engineering design.
A 2.2 cm GSD orthomosaic with surveyed GCPs produces sub-inch horizontal accuracy. That level of precision, when used for boundary definition, grading calculations, or civil engineering design, legally qualifies as a survey in most U.S. states. Surveyors require a license. Offering mapping services commercially without understanding these requirements is a liability.
See Crawl 2: Where the Legal Lines Are before offering mapping services commercially.
FAQ
Q: Can I get away with less overlap to save battery?
A: Yes — you’ll regret it. 60% overlap saves one flight but costs accuracy, coverage gaps, and client complaints. One extra battery ($120) costs less than a callback or accuracy failure.
Q: Should I adjust parameters for season or time of year?
A: For vegetation and shadows, yes. In summer with full leaf cover, bump side overlap by 5% — forest shadows make feature matching harder. Winter with bare deciduous trees lets you use standard overlap. Early morning and late afternoon sun throw long shadows that hurt feature matching. Midday works best.
Q: What if my drone has different camera specs than the Mini 4 Pro?
A: Use the GSD formula with your sensor specs. The DJI Mini 3 Pro has identical sensor specs to the Mini 4 Pro. The DJI Air 3 has a larger sensor — roughly double the GSD at the same altitude. The Autel Evo Nano has slightly different focal length. Recalculate for your hardware.
Q: Does processing software make up for poor flight parameters?
A: No. Garbage in, garbage out. Software can’t invent matching points that don’t exist. Pix4D, Metashape, and WebODM all depend on overlap quality. Fix it in flight, not in post-processing.
Q: How do I know if my flight was good?
A: Check three things immediately after landing: (1) Image count — should match your plan within ±10%. (2) GPS tags on images — verify they’re not clustering at one location. (3) SD card space — confirms the camera interval fired. Review orthomosaic edge stitching and coverage gaps before leaving the site if possible.
Q: Can I fly faster in good wind conditions?
A: No — counterintuitively. Wind is the problem. Fast flight + wind = rolling shutter distortion + altitude variation + coverage gaps. Fly slower in wind, not faster. Reserve speed for calm conditions.
Flight parameters aren’t abstract settings. They’re concrete decisions with measurable tradeoffs.
80% frontal overlap and 70% side overlap are your baseline. They deliver professional accuracy (0.5-1.5 cm horizontal) without excess overhead. At 200 feet altitude with the Mini 4 Pro, that’s ~2.2 cm GSD in 12 MP mode — sufficient for most commercial work. Fly 4 m/s with 2-second intervals to hit that overlap consistently.
Adjust altitude based on detail requirements, not habit. Coverage per battery drives battery budget — budget 3-4 flights for 20 acres at 200 feet. Wind above 10 mph degrades both altitude consistency and forward motion. Postpone if gusts are forecast.
The optimization matrix above covers 90% of real jobs. Terrain complexity, vegetation, and shadows are the edge cases — add 5-10% to overlap when in doubt. And remember: processing quality depends on flight execution. No amount of post-processing fixes poorly overlapped imagery.
Get the parameters right in flight. Everything downstream gets easier.
Up Next
Flight parameters are locked. Next: automating the mission so you’re not hand-flying each line. See Walk 7: WaypointMap vs Litchi vs Manual Flight for workarounds on the Mini’s missing SDK.
Then: what to do with your imagery. Walk 8: WebODM vs Pix4D for Consumer Drone Data compares free and paid processing paths on the same dataset.