



You have a consumer drone. You’ve flown it around your backyard. Now you want to try something real — a property survey, a construction site overview, a quick area estimate. You need an orthomosaic — a georeferenced aerial map you can actually measure on. The problem: Pix4D costs around $332/month, Metashape Standard is $179 (one-time perpetual), DroneDeploy wants a subscription. You’ve got a $400 drone and a laptop. Can you make a real orthomosaic?
Yes. Ninety minutes, start to finish. No expensive software. No ground control points. No surveying equipment. You walk away with a georeferenced mosaic you can use for property documentation, area calculation, and visual change detection.
What You Need
Three things. That’s it.
The hardware:
- Consumer drone with manual flight mode (DJI Mini 4 Pro, Mini 3 Pro, Air 3, Autel Evo Nano). The Mini 4 Pro is recommended — sub-250g regulatory advantage, 48 MP camera, solidly fast processing.
- Laptop with 8 GB RAM, SSD storage, and USB or SD card reader. Windows, Mac, Linux all work.
- Flat, open area to fly (5 to 20 acres for your first mission). No trees overhead, no structures blocking wind.
The software:
- WebODM (free, open source). Download from webodm.org. Runs locally on your laptop. Processes 100 images in 30–90 minutes depending on computer specs. Or use WebODM Lightning, the free tier of their cloud version, for hands-off processing.
- Pix4D free trial (30 days, full features). Alternative to WebODM if you want to compare workflows.
The knowledge:
- Understand lawnmower grid pattern flying (explained below).
- Grasp what overlap means (it’s critical — explained below).
- Know where to find your images after flight (microSD card or USB cable).
That’s the complete list. You don’t need GCPs. You don’t need a survey-grade RTK receiver. You don’t need a tower desktop. This is consumer-grade tooling producing a usable orthomosaic. The accuracy won’t be centimeter-level — you’re looking at 2–5 meter horizontal accuracy depending on GPS conditions. That’s fine for documentation, area measurement, and visual comparisons.
Step 1: Plan Your Flight (15 Minutes)
You’re about to fly a grid pattern. The grid does two things: covers your area completely, and ensures every point on the ground appears in multiple overlapping images. Photogrammetry software uses that overlap to stitch images into a continuous orthomosaic.
Define Your Area
Open Google Maps on your laptop. Find your project site — a property, a construction site, a parking lot. You’re looking for anything from 2 acres up to 20 acres. If it’s your first flight, start small. Smaller is faster to process.
Take a screenshot. Print it or open it on a tablet. You’re about to draw a flight grid on top of it.
Set Your Altitude
For this first flight, use 200 feet (61 meters) altitude above ground level. At this altitude with a DJI Mini 4 Pro (48 MP, 1/1.3-inch sensor):
- Ground sample distance (GSD) is approximately 2.2 centimeters per pixel — each pixel covers a 2.2 cm x 2.2 cm patch on the ground. That’s detailed enough to pick out individual features and plenty for area measurement. (See the GSD Calculator for exact values at any altitude.)
- Flight time runs about 4–5 minutes per acre, depending on winds and overlap.
- One battery covers the whole mission (the Mini 4 Pro gets ~25 minutes of flight time; a 20-acre grid takes about 20).
If your site is smaller (under 5 acres), you could fly lower — 100 feet (30 meters) for ~1.1 cm/px GSD. If it’s larger, go higher to cover more ground per battery. For your first attempt, 200 feet is the sweet spot.
Plan Your Grid
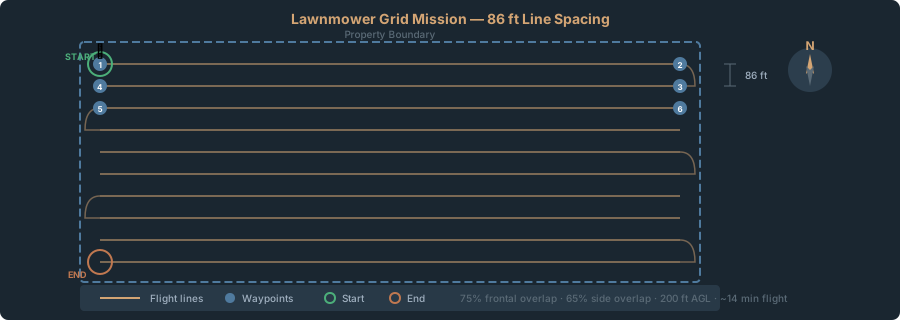
Open your site image. Break it into parallel strips running north-south (or east-west — doesn’t matter). The strips overlap by 70 percent side-to-side. Within each strip, consecutive images overlap by 80 percent front-to-back.
Here’s what this means in real terms at 200 feet altitude with a Mini 4 Pro (12 MP mode):
- Each image covers approximately 288 x 216 feet on the ground (88 x 66 m).
- For 80 percent frontal overlap, the drone advances about 43 feet (13 m) between shots.
- For 70 percent side overlap between strips, each strip is spaced about 86 feet apart (26 m).
You’re flying north-south lines spaced roughly 86 feet apart, capturing images every 43 feet along each line. The result looks like a lawnmower pattern on your site map — parallel lines covering the entire area.
Draw this grid on your screenshot. Mark the start point, the flight lines, and the direction. You’ll fly this pattern manually in the field.
Calculate Flight Time and Battery Needs
Count the number of images you’ll capture. For a 10-acre rectangular site (660 feet x 660 feet), flying strips spaced 86 feet apart at 43-foot image spacing:
- You’ll fly 8 strips north-south.
- Each strip at 660 feet with 43-foot spacing = 16 images per strip.
- Total: 8 strips x 16 images = ~128 images, 20 minutes of flying.
One battery is plenty. If your site is larger, plan for multiple batteries (bring 3–4 spares if you’re flying 20+ acres).
Step 2: Fly the Mission (20 Minutes)
You’re doing this manually — no DJI Terra, no waypoint app. The DJI Mini 4 Pro doesn’t have an official SDK for autonomous missions. Honestly, that’s fine. Manual grid flying teaches you altitude and overlap discipline faster than any autopilot would.
Pre-Flight Checklist (5 Minutes)
- Battery charged. 100 percent, two spares in your bag.
- SD card inserted. Cleared of old footage, at least 16 GB free space.
- Camera settings. Photo format RAW+JPEG (or JPEG if you don’t need raw files — they process identically for orthomosaics). Aperture f/2.8 or stopped down to f/4 to f/5.6 for depth of field. ISO automatic. White balance sunny (not auto).
- Airspace clear. No manned aircraft operations nearby (check ADS-B or call local airports). No towers, power lines, or trees in your grid zone.
- FAA compliance. You’re flying commercially (creating deliverables), so you need Part 107 certification. That’s not in scope here, but it’s legally required.
Launch and Takeoff
Launch from a clear, level area. Climb to 200 feet. You’ve got your printed grid map or it’s on a tablet — reference it constantly.
Fly the Grid
Fly the first line north-south (or east-west — consistency matters more than direction). DJI drones hold altitude automatically once you release the stick.
Steady ground speed. Fly slowly — 5–10 mph (8–16 km/h). You’re flying a camera platform, not racing. At 10 mph, you cover about 30 feet every 2 seconds. The drone’s camera shoots automatically every 2 seconds (DJI default). At 10 mph with 2-second intervals, that gives you images spaced about 30 feet apart — well within 80 percent overlap for the 288-foot image footprint. If you prefer slower (and easier to control), 5 mph with 2-second intervals gives ~15-foot spacing — plenty of overlap.
Straight lines. Use heading hold with the gimbal pointing straight down. Watch the compass and avoid yawing (rotating). Consistent heading makes for consistent stitching.
Constant altitude. Altitude hold handles this for you, but keep an eye on the readout. Wind pushes you around — correct gently.
Mark your strips. Finish the first north-south line, slide east about 86 feet, fly the next line back. Repeat until you’ve covered the grid.
Image count. You’ll capture 30–150 images depending on site size. Start with 50 images on your first mission — that’s a 5-acre area at 200 feet altitude.
Offload Images
Land and power down. Remove the microSD card (or connect via USB). Copy the DCIM folder to your laptop. You’re looking for a folder named something like DCIM/100MEDIA/ containing all your images. Copy the entire folder to your computer’s Documents folder or Desktop — you’ll reference it in processing.
The entire flight — launch, landing, and offload — takes 20–25 minutes.
Step 3: Download and Organize Images (10 Minutes)
You’ve got 50–100 images on your hard drive. Before processing, verify three things: image count, GPS tags, and filename structure.
Verify Image Count
Open your DCIM folder. Count the JPEG (or raw) files. You should have roughly the number you planned. If you captured 120 images and planned for 50, you were flying slower than expected or the drone was shooting faster. That’s fine — extra images improve overlap, improving orthomosaic quality.
Check GPS Tags
Open one image in Google Earth Pro or Apple Photos. If the image shows a location and timestamp, GPS embedding is working. DJI drones embed GPS automatically. Just verify it’s there.
If GPS is missing, something went wrong — wrong camera settings or old firmware. Don’t proceed until you’ve got GPS-tagged images.
Organize the Folder
Create a new folder on your desktop: FirstOrthomosaic. Move all your images there. You want a single folder with just the images — no subfolders, no duplicates.
Don’t rename the images. Software needs the original DJI filenames and metadata intact. Leave them exactly as captured.
Pro tip: On your next mission, you might want to create folders by date (2026-05-03_ProjectName). For now, keep it simple. One folder, one day’s images, ready to process.
Step 4: WebODM Tutorial — Process Your First Orthomosaic (50 Minutes)
This is where overlapping photos become an orthomosaic. WebODM handles the geometry — tie point matching, bundle adjustment, orthorectification, stitching. You feed it photos; it spits out a map.
Install WebODM (First Time Only)
Go to webodm.org. Download the desktop version for your operating system (Windows, Mac, or Linux). Extract the ZIP and run the executable. First launch takes a minute as it sets up Docker containers.
Alternatively, use WebODM Lightning — the free cloud tier. Create an account, upload images, and processing happens on their servers. No installation needed. Processing takes 1–2 hours for 100 images but requires zero setup.
This tutorial uses the desktop version — faster, fully under your control, and open source.
Launch WebODM and Create a Project
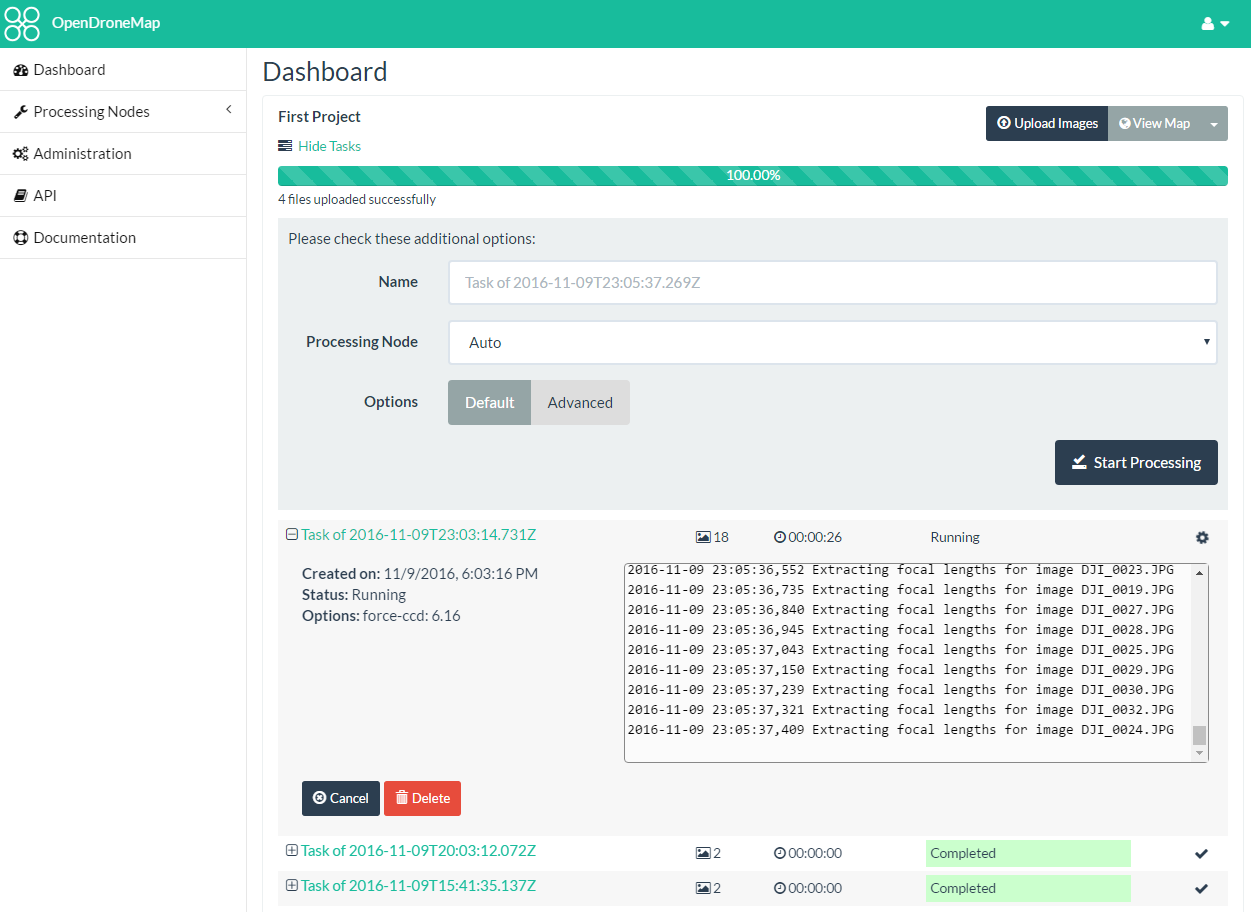
Start WebODM and create a new project — call it “FirstOrthomosaic” or “May3_PropertySurvey”. The interface looks like it was designed in 2015, but it works.
Upload Your Images
Click “New Task” or the upload button. Select all images from your FirstOrthomosaic folder. Drag and drop works too. Upload takes 2–5 minutes — you’re loading about 100 JPEGs, roughly 30–50 MB total.
WebODM extracts GPS coordinates from each image and plots them on a map. You should see a tight cluster of points at your project location — those are your image GPS footprints. If they’re scattered across the globe, GPS embedding failed. Delete the task and recheck your images.
Clean cluster? You’re good to go.
Choose Processing Settings
WebODM displays a “Processing Options” dialog. Use default settings for your first orthomosaic:
- Reproject to UTM: Yes (WebODM automatically detects which UTM zone your images fall into).
- Quality: Medium (processes faster than High, suitable for your first attempt).
- Orthophoto enabled: Yes.
- Point cloud enabled: Yes.
Don’t change anything else. Click “Start Processing.” Behind the scenes, WebODM:
- Extracts and matches tie points across overlapping images (feature matching).
- Solves bundle adjustment — figures out exactly where the camera was and how it was oriented for every shot.
- Generates a dense point cloud (thousands of 3D points representing the surface).
- Builds a digital surface model (DSM) — a continuous elevation grid.
- Orthorectifies each image (removes tilt and terrain distortion).
- Stitches everything into one continuous orthomosaic.
- Writes out a GeoTIFF — your final deliverable.
Processing time: 45–90 minutes on a laptop with 8 GB RAM and a modern CPU for 50–100 images. 30–45 minutes on a desktop with 16 GB RAM and an SSD. Desktop processing is worth it if you do this regularly.
Go grab coffee. WebODM notifies you when it’s done (if you have desktop notifications enabled).
Step 5: Review Your Orthomosaic (10 Minutes)
WebODM shows your results on a map — orthomosaic, point cloud, DSM, and processing stats.
Download the Orthomosaic
Look for the Assets or Downloads section. You’ll see several files:
orthophoto.tifororthophoto.tiff— this is your orthomosaic as a GeoTIFF.pointcloud.ply— your 3D point cloud (you can skip this for now).dsm.tif— digital surface model (elevation grid).report.pdf— processing statistics.
Download orthophoto.tif to your desktop. That’s your finished orthomosaic — georeferenced and stitched.
Open It in Google Earth Pro or QGIS
Google Earth Pro (free, easier): Download and install. Go to File, Import, select your orthophoto.tif. The image drops onto the map at its real-world location — your site appears as an overlay on satellite imagery. Zoom in, measure distances with the ruler tool, draw polygons for area calculations. Measurements are accurate to your orthomosaic’s precision (2–5 meters without GCPs).
QGIS (free, more powerful): Download and install. Create a new project. Layer, Add Raster Layer, select your orthophoto.tif. It reprojects automatically to match your base layers. Now you’ve got a real map — measurable, overlayable with boundaries, comparable across time.
What to Look For
Stitching quality: Look at seam lines where overlapping images join. They should be invisible. If you see bright lines, dark zones, or blurry transitions, that usually means:
- Spacing was too wide (not enough overlap).
- Motion blur from flying too fast or fighting wind.
- Lighting shifted between images (sun angle changed, or exposure wasn’t consistent).
Blur and sharpness: The orthomosaic should be sharp. You should see individual driveway cracks, parking lot lines, and roof shingles. If the entire mosaic looks soft, your original images were motion-blurred during flight.
Coverage gaps: Scan the entire orthomosaic. Every part of your project area should be covered. If you see white or transparent zones, you missed flying that section. Next time, extend your grid slightly beyond your intended area to avoid edge gaps.
Color consistency: Look for uniform color across the mosaic — no abrupt bright or dark patches. Color banding means the software struggled to match exposures. Cosmetic issue only; measurements are still accurate.
Geolocation accuracy: Overlay your orthomosaic on Google satellite imagery in Google Earth Pro. Alignment within 10–15 feet is normal with consumer GPS. Off by 50+ feet? Something went wrong with GPS embedding, or you flew the wrong area.
What to Expect: Honest Quality Assessment
So you’ve got an orthomosaic. Made it in 90 minutes with a consumer drone and free software. Here’s what it actually gives you.
Accuracy Without Ground Control
Your orthomosaic is georeferenced but not survey-accurate. The GPS receiver in your consumer drone delivers ±3–5 meter horizontal accuracy. Every coordinate in the orthomosaic could be off by up to 5 meters from its true ground position. Directionally correct, not centimeter-precise.
In practice:
- Areas and distances measured within the image are accurate (scale is uniform inside the mosaic).
- Overlaying on satellite imagery works — alignment is close enough for visual comparison.
- It’s not a surveying deliverable. Not without GCPs.
- It works great for site documentation, progress tracking, and ballpark area estimates.
If you need survey-grade accuracy (1–3 cm), you’ll need GCPs. That’s covered in Walk Phase 4: DIY GCPs for Non-Surveyors.
Image Quality Issues
You may see:
- Stitching artifacts on edges: Strip boundaries sometimes show slight misalignments or color jumps. Par for the course when stitching 100 images with consumer GPS. Doesn’t affect measurements.
- Blur zones: Wind or prop vibration blurs some frames. The stitcher blends these with sharp ones, so you get soft patches mixed in. Functional, not pretty.
- Repeat objects: Cars or people that moved between frames sometimes appear twice — a ghost effect. Rare on static property surveys, but common on busy sites.
Processing Artifacts
WebODM has known limitations:
- Building lean: Tall structures tilt away from the camera. The software corrects for nadir (straight-down) perspective, but buildings partially visible at oblique angles in source images create this effect. True orthomosaics correct this; DSM-based ortho doesn’t.
- Vegetation edges: Trees and dense vegetation have soft, smeared edges — different elevation across the canopy confuses the software about where the surface is.
These are photogrammetry limitations, not WebODM bugs. They don’t prevent measurement — just know they’re there.
Common Issues and Fixes
Something went wrong. Here’s what to check.
Processing Failed or Took Too Long
Cause 1: Out of memory. You’re running out of RAM mid-processing. Fix: Close other applications. Reduce Quality from High to Medium. Still failing? Process on a machine with more RAM or use WebODM Lightning (cloud processing).
Cause 2: Internet connection dropped mid-upload. Fix: Delete the task and re-upload. WebODM doesn’t resume partial uploads well.
Cause 3: Too many images. Fix: WebODM handles 300+ images but gets slow. For 500 images, process in batches (1–250, then 251–500) and stitch outputs in QGIS.
Orthomosaic Looks Blurry
Cause 1: Images themselves are blurry. Fix: Review your source images before processing. If half are motion-blurred, you flew too fast or the wind was too much. Refly slower. No software fixes blurry source images.
Cause 2: Processing Quality setting was too low. Fix: Reprocess at Quality=High. Takes longer, produces sharper results.
Cause 3: Scene has lots of repetitive texture (grass, water, sand). Fix: Feature matching fails on featureless ground. Add distinctive objects to your flight area (temporary markers) so the software has features to match. Or accept the softer output — it’s still usable.
GPS Footprints Show Scattered Points, Not a Cluster
Cause: GPS embedding failed — old DJI firmware or camera settings skipping GPS. Fix:
- Check image GPS metadata. Open one in ExifTool (free command-line tool) or ExifData (phone app) to verify GPS coordinates.
- Update drone firmware to latest version.
- Refly with correct camera settings.
If images have no GPS, you can’t process them with automatic georeferencing. Use ground control points or manual GPS entry — both are beyond this first mission’s scope.
Orthomosaic Doesn’t Align with Google Maps When Opened in Google Earth Pro
Cause: A 15–50 foot offset is normal with consumer GPS. Fix: Nothing to fix — that’s how consumer GPS works. Your orthomosaic is still usable for area measurement and visual comparison. Want tighter alignment? Deploy 5–10 GCPs on your next flight.
Deliverables: What You’re Actually Getting
When you download orthophoto.tif, here’s what you’re getting:
A GeoTIFF file — a raster image with embedded coordinate system metadata (EPSG code, geotransform, CRS). Every pixel maps to a lat/long coordinate. File size runs 100–500 MB depending on site size.
Horizontal accuracy: ±2–5 meters (consumer GPS, no GCPs).
Ground resolution: ~2.2 cm/pixel at 200 feet altitude with the Mini 4 Pro (12 MP mode). You see individual driveway cracks and roof shingles.
File format: GeoTIFF opens in everything — Google Earth Pro, QGIS, ArcGIS Pro, Pix4D, CloudCompare, you name it.
What you can do with it:
- Measure distances and areas directly.
- Pull coordinates for boundary points, utility poles, features.
- Overlay on satellite imagery to check alignment.
- Use as a base layer in a GIS project.
- Hand it to a non-technical client and they’ll understand it immediately (Google Earth Pro, no training needed).
What you can’t do:
- Use it for legal boundary surveys (no GCPs, insufficient accuracy).
- Claim survey-grade accuracy without GCPs and independent testing.
- Overlay with design drawings or as-builts at sub-meter precision (the offset will be obvious).
Before you sell this. Producing orthomosaics for clients may trigger state surveying license laws. The 4th Circuit ruled in 2024 that any output “capable of measurement” falls under surveying regulations. A georeferenced GeoTIFF meets that test. See Crawl 2: Where the Legal Lines Are before offering mapping services commercially.
FAQ
Q: Can I process 200 images on my laptop without it melting?
A: Yes. It takes 2–3 hours instead of 30 minutes. WebODM scales to your hardware. Processing daily? Upgrade from 8 GB to 16 GB RAM and add an SSD — worth it. Or use WebODM Lightning for cloud processing — 200 images cost $5–10 in compute time.
Q: What if I need the orthomosaic to be more accurate?
A: Deploy 5–10 ground control points (GCPs) on your next flight. GCPs reduce horizontal error from 2–5 meters to 10–30 cm. See Walk Phase 4: DIY GCPs for Non-Surveyors.
Q: Can I stitch multiple orthomosaics together if I flew a large area?
A: Yes. Process each day’s images separately in WebODM. Load all GeoTIFFs in QGIS and use Raster → Miscellaneous → Merge. They mosaic together at overlapping edges, producing one large GeoTIFF covering your entire area.
Q: How do I know if WebODM is working correctly, or if it’s just stuck?
A: Watch the processing log in the WebODM interface. You see text describing stages: “Initializing ODM…” → “Running feature detection…” → “Running point cloud processing…” → “Generating DSM…” If the log freezes for 2+ minutes, something crashed. Check memory and CPU — if maxed out, it’s working slowly. If memory is normal and nothing happens, restart.
Q: Can I use Pix4D free trial instead of WebODM?
A: Yes. Workflow is identical: upload images, choose quality, process, download orthomosaic. Pix4D is more polished and includes calibration reports, but WebODM is free and equally capable for your first orthomosaic.
Q: Do I need to fly in a specific time of day?
A: Midday (10 AM–3 PM) is best — high sun angle, minimized shadows, consistent lighting. Early morning and late afternoon produce long shadows that complicate stitching. Overcast works — consistent lighting everywhere. Avoid rapid cloud cover changes (moving shadows).
Q: What’s the smallest site I can realistically map?
A: A backyard (100 feet x 100 feet) produces a good orthomosaic. At 200 feet altitude, you capture 4–8 images. Processing takes 5 minutes. Constraints: (1) enough overlap to stitch — minimum 3–4 images covering the same area, and (2) processing improves with more images — 30+ images produce strong tie points. Start with 20–30 images for reliable results.
Q: What’s the largest site I can realistically map on one battery?
A: The DJI Mini 4 Pro is rated for 25 minutes flight time. At 200 feet altitude with 80% overlap, you cover 5 acres per 20 minutes. One battery covers 5 acres. Beyond that, bring multiple batteries — 3–4 spares for 20+ acres.
Q: Can I process raw images instead of JPEGs?
A: Yes. WebODM and Pix4D accept DJI raw files (.DNG format) and produce identical orthomosaics to JPEG processing — plus more color correction options. For your first mission, JPEGs are simpler: smaller files, faster upload, identical mapping results.
Next Steps
Crawl 3: Fly the same area with ground control points (GCPs) and benchmark accuracy improvement. Measure the difference yourself — honest numbers on how many GCPs you need and where.
Walk 4: DIY GCPs in detail — mark them in the field, measure without survey equipment, deploy for your next flight.
Walk 5: Flight parameters decoded — what overlap means for accuracy, how altitude affects GSD, how to optimize for your specific goals.
You’ve got a processed orthomosaic — georeferenced, measurable, ready to overlay on CAD plans, satellite imagery, or previous flights. In 90 minutes with free software, you went from “I have a drone” to “I produce drone mapping deliverables.”
Everything from here is refinement. Accuracy, automation, delivery formats, cloud processing. But the core skill — flying a grid and producing an orthomosaic — that’s done.
Ninety minutes, under 5 acres, consumer drone, your laptop. Fly a manual lawnmower grid at 200 feet altitude — 80% frontal overlap, 70% side overlap. Capture 50–100 images. Upload to WebODM. Process. Download the GeoTIFF. Open in Google Earth Pro.
Accuracy without GCPs is 2–5 meters — good for area measurement and visual comparison, not survey-grade. Quality issues (stitching artifacts, blur zones) are normal with this workflow. They don’t prevent use.
This is the bridge from “I fly a drone” to “I produce mapping deliverables.” GCPs, accuracy benchmarking, cloud processing, software comparisons — all of it builds on this workflow.
For foundation, see What Is an Orthomosaic. For next steps with GCPs, see Crawl 3: DJI Mini Mapping Accuracy Benchmarks. For GCP deployment, see Walk 4: DIY GCPs for Non-Surveyors.